Urban Heat Islands
This lesson plan promotes awareness, critical thinking, and practical problem-solving for urban environmental challenges Understand the urban heat effect on cities.
-
Define an Urban Heat Island (UHI) and explain how it forms.
-
Identify factors that contribute to UHIs.
-
Analyze the effects of UHIs on the environment, human health, and urban areas.
Materials Needed:
Thermometers or infrared temperature sensors (optional, for outdoor activity).
Chart paper or whiteboards for brainstorming.
Handouts or digital access to UHI-related data for analysis.
Lesson Outline
1. Introduction
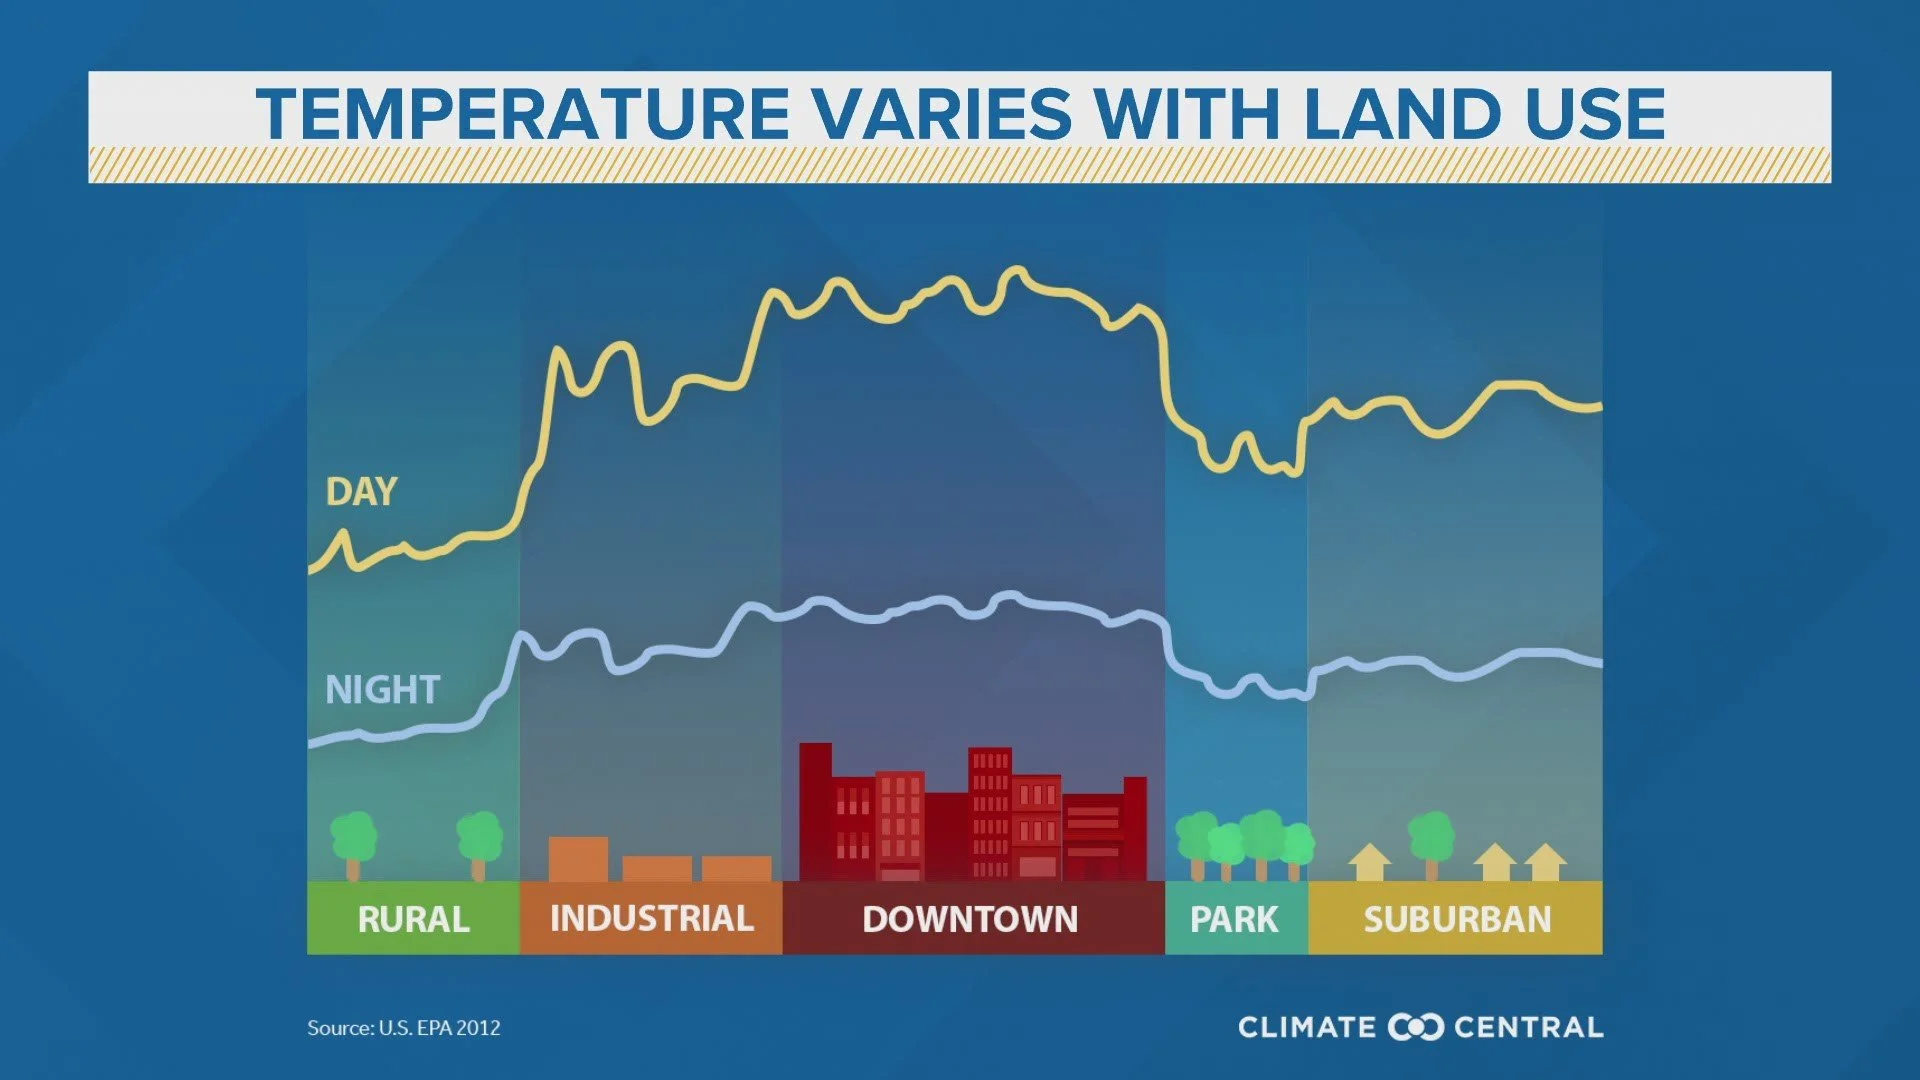
Engage: “Have you ever noticed it feels hotter in the city than in the countryside?”
Discuss possible reasons behind the temperature difference.
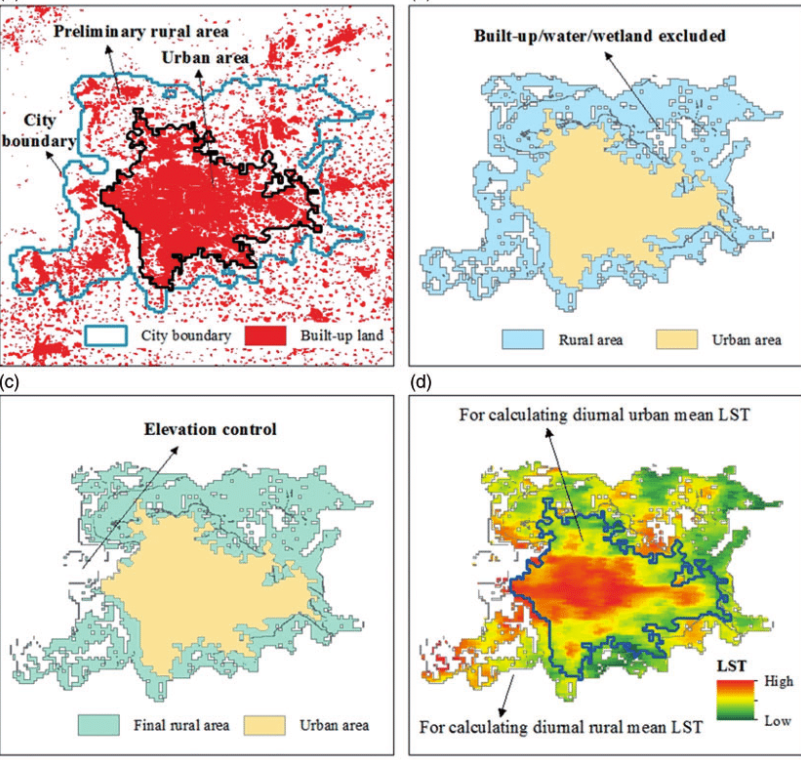
Urban Heat Island (UHI):
An urban area that is significantly warmer than its surrounding rural areas.
(Sources: Research Gate, weareiowa.com, Otesection)
2. Exploration Activity: UHI Factors
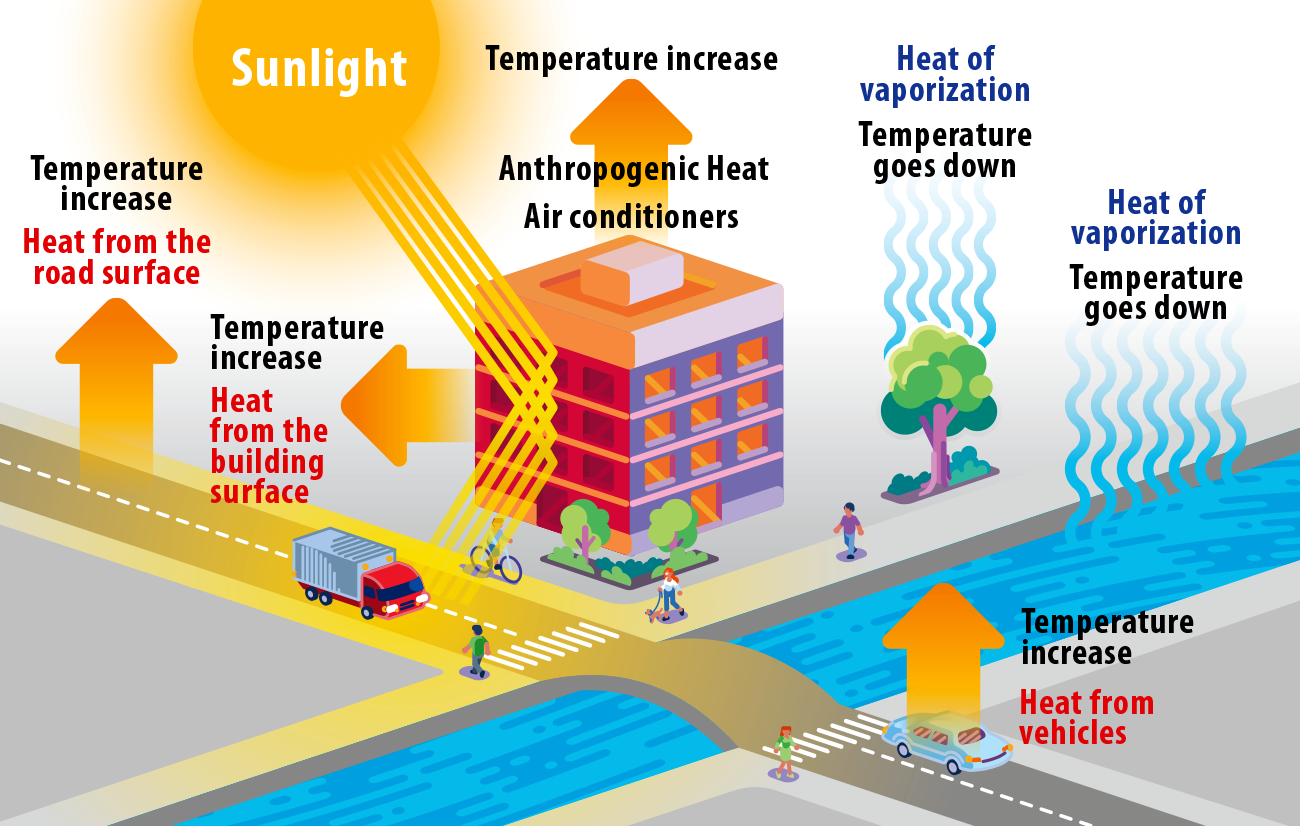
Key Factors:
Heat-absorbing materials like concrete and asphalt.
Lack of vegetation and green spaces.
Waste heat from vehicles, buildings, and industries.
Urban geometry trapping heat.
Group Activity:
Split students into small groups. Provide each group with a UHI factor and ask them to:
Explain how their factor contributes to UHIs.
Give examples or evidence from their own city or local area.
Groups will share findings with the class.
3. Presentation: UHI Impacts
Environmental Impacts:
Increased energy consumption for cooling.
Elevated air pollution and greenhouse gas emissions.
Stress on urban water systems.
Health Impacts:
Heat-related illnesses and mortality, especially for vulnerable populations.
Poor air quality exacerbating respiratory issues.
Economic Impacts:
Higher energy costs for households and businesses.
Engage: Show a short video highlighting impacts of UHI effects.
4. Mitigation Strategies
Strategies:
Planting trees and creating green roofs.
Using reflective materials for rooftops and pavements.
Designing sustainable urban landscapes with parks and water bodies.
Promoting energy-efficient building designs.
5. Reflection Activity
Objective: Apply knowledge and encourage creative thinking.
Scenario: Imagine you are an urban planner tasked with reducing the UHI effect in your city. Write a short plan outlining three specific actions you would implement and explain how they would help.
Volunteers share their ideas with the class.
Assessment
Formative: Participation in group activities and discussions.
Summative:
Write a brief report explaining the causes and impacts of UHIs.
Create a poster or digital infographic showcasing UHI mitigation strategies.
Extensions/Enrichment
Outdoor Experiment: Measure temperature differences in shaded versus sun-exposed areas around the school or neighborhood.
Research Project: Investigate how different cities around the world are combating UHIs and present findings.