Global Warming
This lesson plan provides an interactive and comprehensive approach to understanding global warming and its impact, fostering knowledge and critical thinking. Learn about global warming and how it has been affecting our Earth.
-
Define global warming and explain its causes.
-
Identify key effects of global warming on the environment.
-
Analyze real-world examples of global warming impacts and discuss possible solutions.
Materials
Whiteboard and markers
Handouts with key facts and discussion prompts
Poster board and markers (for group activity)
Lesson Outline
1. Introduction
Engage: “How do you think the world might look 50 years from now if temperatures continue to rise?”
What is Global Warming?
Global warming is the increase in temperatures observed over time. Increasing concentrations of greenhouse gases has trapped heat into Earth’s atmosphere.
Root causes:
Greenhouses gas emissions: Carbon dioxide and methane trap sun’s heat in the atmosphere, making it feel hotter on Earth.
Deforestation: Cutting down trees means less carbon dioxide is removed and stored in trees,
Industrial activities: Such human activities, such as burning fossil fuels contribute heavily to greenhouse gases released.
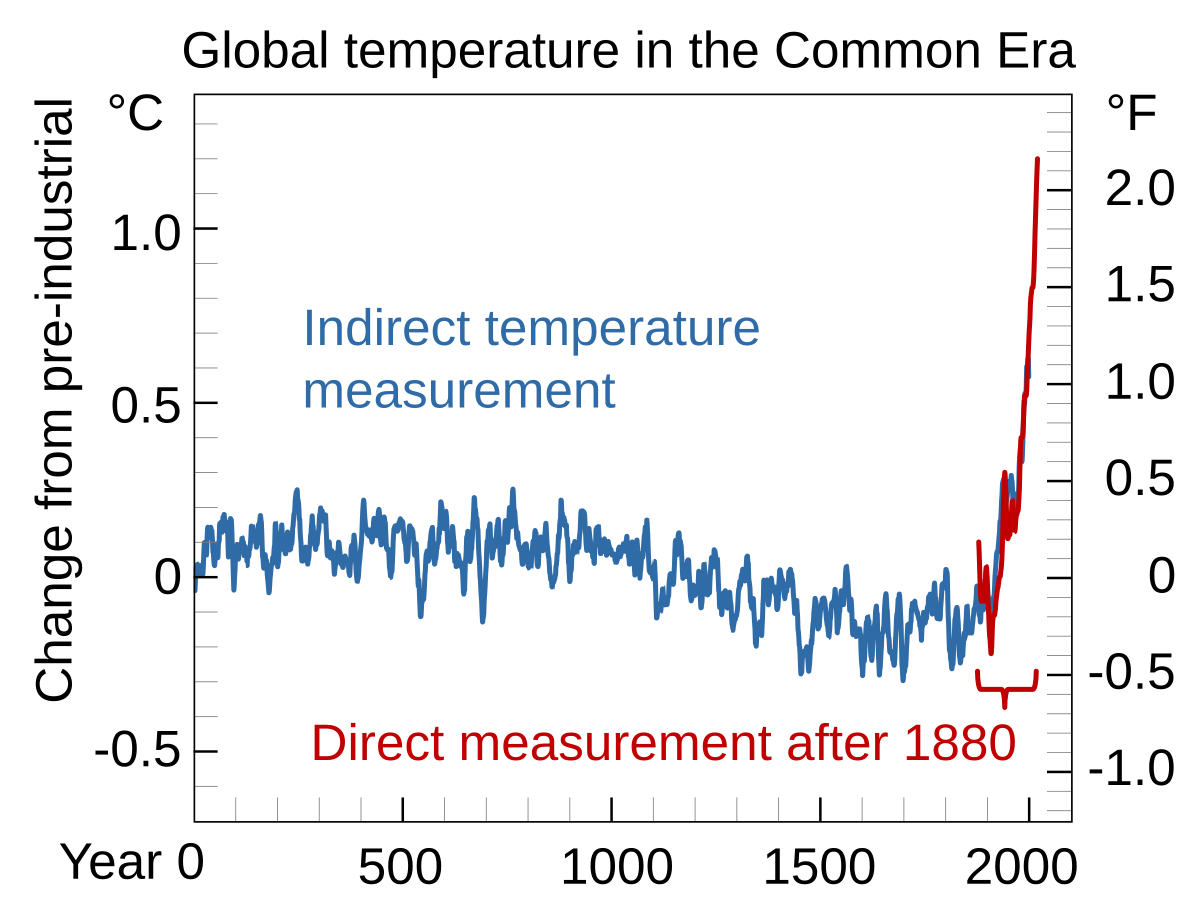
(Credit: The New York Times)
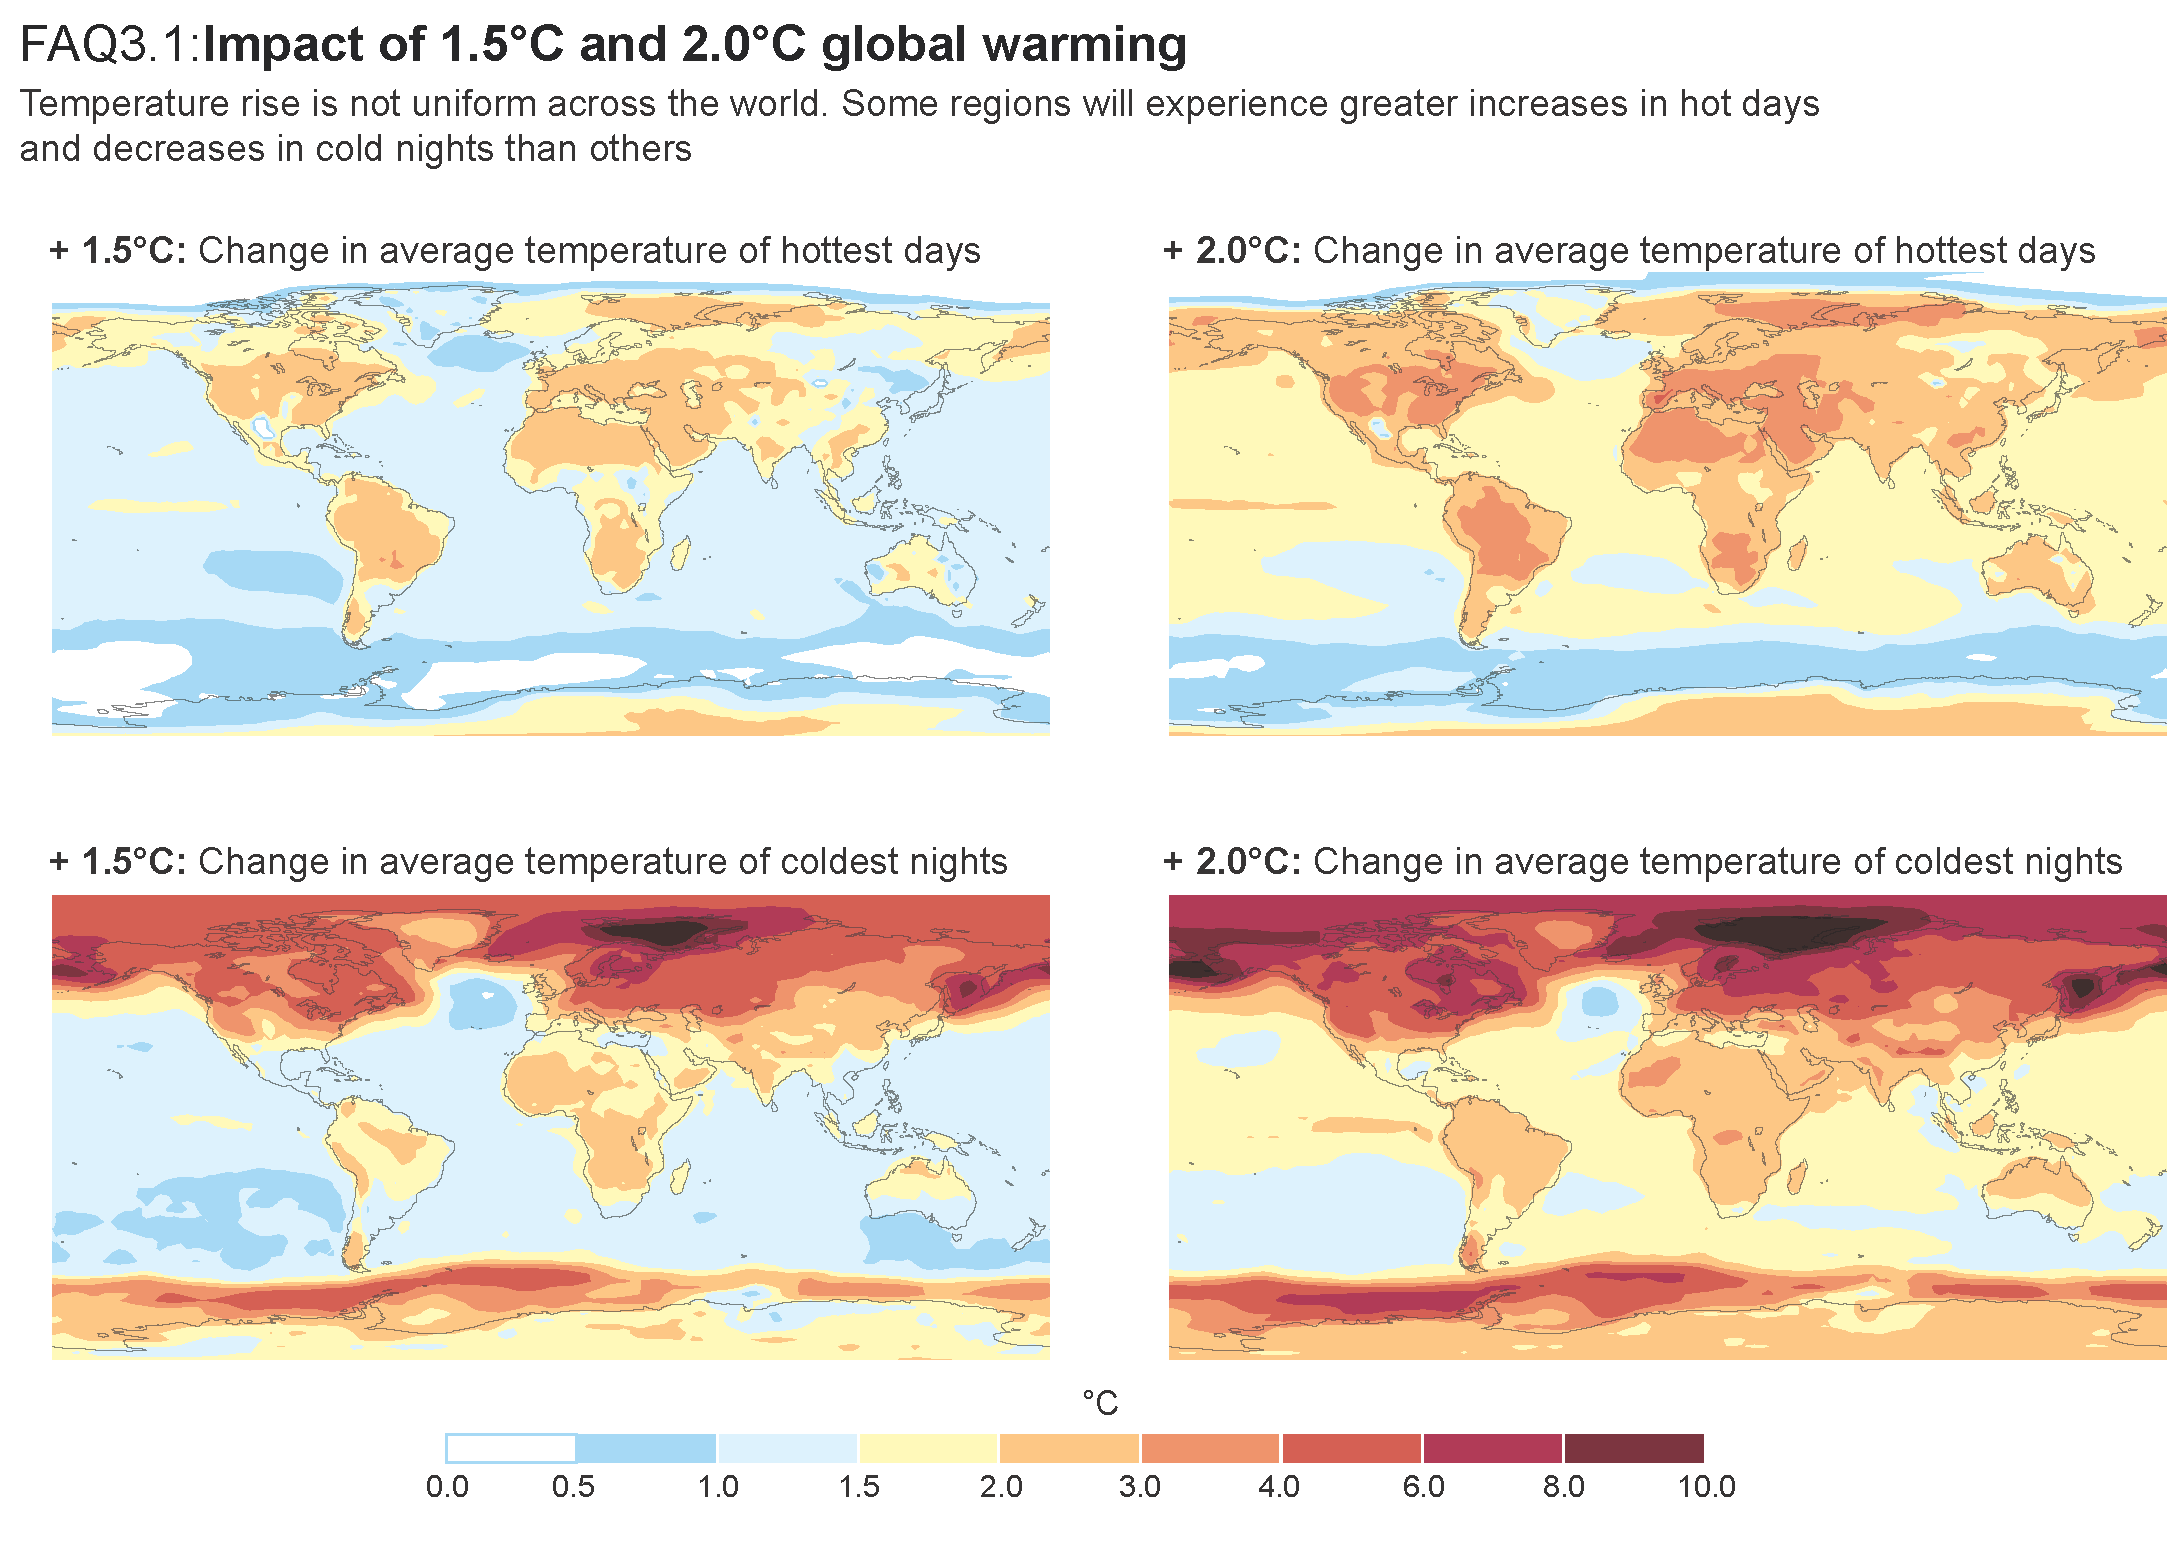
(Credit: ipcc.ch)
Global temperature have been on the rise for the past 10 years.
If we continue as now, the rise temperatures will only increase over time.
2. Explanation
What are Greenhouse Gases (GHGs)?
Greenhouse gases create a “blanket” on earth; it creates esa greenhouse effect, meaning the GHGs trap the sun's heat and prevent it from escaping back to space. GHGs include:
CoO2 from vehicles, electricity generation, and factories
Methane from landfills, livestock, rice production
Nitrous oxide from fertilizers
Hydrofluorocarbon from AC and refrigeration systems
Effects on the Environment
Many factors have been associated with global warming. Rising temperatures have taken a toll on our environment and its main factor is man-made activity.
Melting ice caps and rising sea levels: Driven by thermal expansion, in which rising temperatures cause molecules to gain energy, move more vigorously, and take up space as well as melting ice sheets that contribute to water volume
Loss of biodiversity: Ecosystems are affected and food chains are disrupted
Extreme weather events (e.g., hurricanes, droughts): From California wildfires to hurricanes in the Atlantic, natural disasters are inevitable ,
Ocean acidification and coral bleaching: Corals expel the colorful algae living in their tissue due to environmental stress; prolonged bleaching makes corals more vulnerable to disease and death.
3. Group Activity
Divide students into small groups.
Assign each group one aspect of global warming's effects (e.g., rising sea levels, wildlife impact, agriculture).
Task:
Research and summarize their assigned topic (use provided handouts).
Create a poster or infographic to illustrate their findings.
Suggest at least two solutions or actions individuals and governments can take to combat the problem.
Presentations: Each group presents their findings to the class (2 minutes per group).
4. Discussion and Reflection
Facilitate a class discussion:
“Which effect of global warming do you think is the most concerning and why?”
“What actions can we take in our daily lives to reduce global warming?”
Encourage students to brainstorm and share ideas.
Summarize the key points discussed during the lesson.
5. Homework/Extension Activity
Assign students to write a short essay on one of the following topics:
How global warming affects their local community.
Ways they can contribute to reducing greenhouse gas emissions.
Alternatively, ask students to track their carbon footprint for a week and suggest ways to reduce it.
Assessment
Participation in group activity and presentation.
Contribution to class discussion.
Evaluation of homework or extension activity.